
|
|
| Home » Livability Toolkit » Outreach to Latino Community » Latino Demographics | |
Lane County's Latino population tends to be younger than the overall population
Besides its diversity, perhaps the most distinctive characteristic of the Latino community in Lane County is its youth. The median age among Lane County Latinos is just 24 years, while the median age for non-Latino whites in the county is 41.12 Fully 22 percent of the county's Latino population is under the age of 10, compared with 10 percent of non-Hispanic whites (see Figure 1). At the other end of the age spectrum, just 2 percent of Latinos were 70 years or older, compared with 11 percent of non-Hispanic whites.
Recent migration explains the youthfulness of Lane County's Latinos. Most Latino growth in the county came from migration, and migration is mostly a young person's venture. The twenties are the peak decade for migration as well as the peak decade of child-bearing years. These two facts, together with many Latino immigrants' poverty (which tends to boost family size) and large-family cultural norms, likely explain the relatively high fertility rate among the county's Latinos. Birthrates among Lane County Latinas (as measured by the share of women in childbearing age to have had a child in the last 12 months) are more than twice as high as among Non-Latina whites.
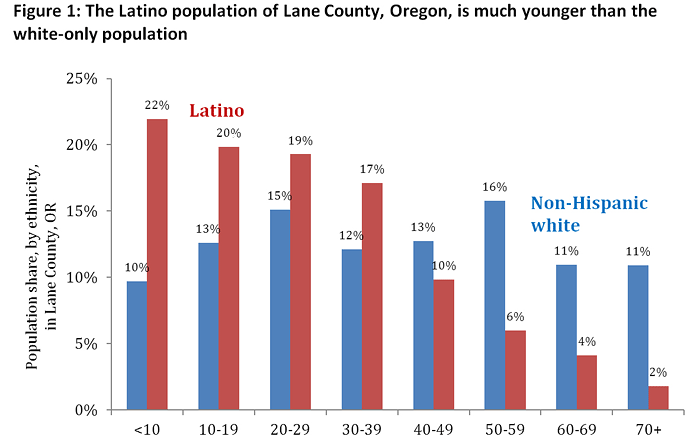
Source: U.S. Census Bureau, 2006-2010 American Community Survey. "Table B01002: Median Age By Sex." U.S. Census Bureau, 2010 Census. "Table PCT3: Single Years of Age and Sex," from Summary File 2.
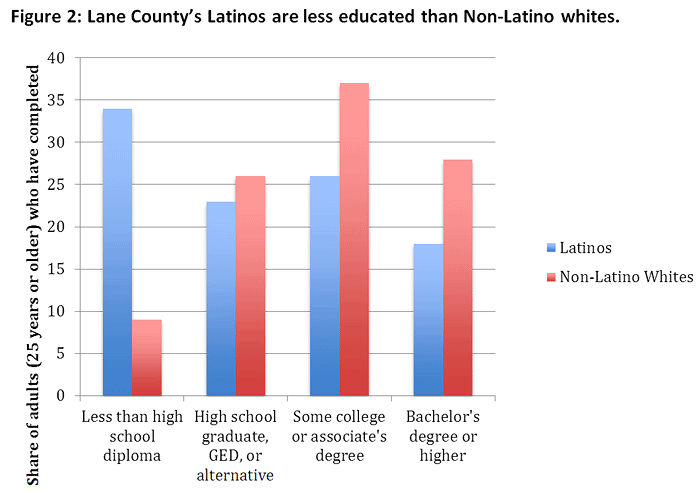
Lane County Latinos have a lower level of educational attainment than the general Population. More than one-third of Latino residents over the age of 25 have not finished high school. Almost a quarter have a high school diploma but no additional education. Another quarter have at least some post-secondary education, but have no degree, a certificate course, or an associate's degree. The final 18 percent have finished a bachelor's degree or more.
Latinos in Lane County are better educated than Latinos overall in the United States or in Oregon, with more college graduates, more associates degrees, and fewer high school dropouts. Still, they have catching up to do to match the county's Non-Latino white majority.16 Adult Latinos trail whites at every educational level: more than three times as large a share of Latino adults hold no high school diploma, and whites have a 10 percentage point lead over Latinos in completion of college and university certificates and degrees.
The American Community Survey (ACS) also allows us to take a closer look beyond overall averages. It provides users with an opportunity to evaluate the differences that exist within racial or ethnic groups. Unfortunately, at the county level, the ACS only provides racial and ethnic diversity data for Latinos along three different categories:
Among the three groups, Central Americans in Lane County are the most highly educated with 31 percent of their population holding at least a bachelor's degree. They also have the lowest percentage of individuals who have less than a high school diploma, at 19 percent. Mexicans in Lane County, on the other hand, are the least educated. The ACS estimates that 35 percent of Mexicans in Lane County have less than a high school education.
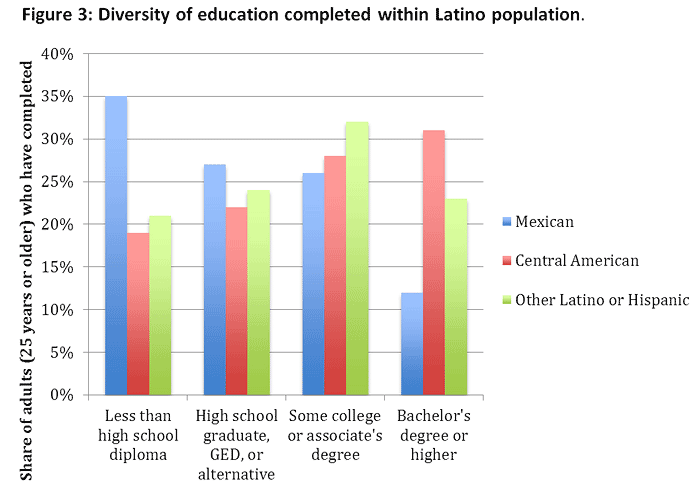
Source: U.S. Census Bureau, 2006-2010 American Community Survey. "Table B15001: Sex by Age by Educational Attainment for the Population 18 and Over."
75 percent of Lane County Latinos identify themselves as Mexican
Like other Latino people across the United States, Lane County Latinos identify themselves less by their Latino/Hispanic ethnicity than by their specific country of origin: they think of themselves not so much as Latino but as Guatemalan or Puerto Rican or Mexican, for example,. In fact, more than 75 percent identify themselves as Mexican (see Table 1), many of whom identify themselves strongly with their home state such as Oaxaca or Michoacán.
| Percent of Total Population | ||
| Latino or Hispanic (of any race) | Lane County | Eugene Springfield CCD |
|---|---|---|
| 7.4 | 8.5 | |
| Mexican | 5.6 | 6.4 |
| Puerto Rican | 0.2 | 0.3 |
| Cuban | 0.1 | 0.1 |
| Dominican (Dominican Republic) | 0 | 0 |
| Central American (excludes Mexican) | 0.4 | 0.5 |
| South American | 0.3 | 0.3 |
| Other Latino or Hispanic | 0.8 | 0.9 |
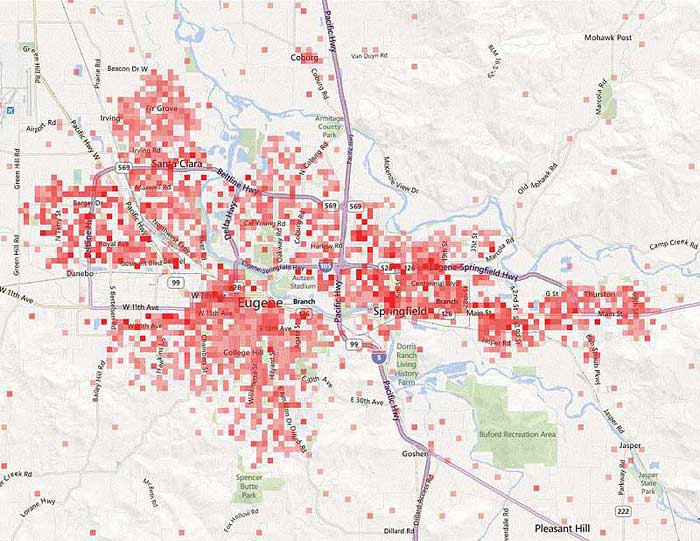
Spatial patterns reveal that Lane County's Latinos are dispersed throughout Eugene and Springfield
Latinos' geographic distribution is widespread Springfield has a higher share of Latino residents than does Eugene. Yet unlike some other cities in Oregon and across the country, the Eugene?Springfield metro area does not appear to have a single neighborhood or region with disproportionate concentration of Latino residents.US Census Bureau, "Table QT-P10:Hispanic or Latino by Type: 2010," from the 2010 Census Summary File 1, as discussed in Eric de Place, "Lane County's Latino Residents," Sightline Daily, 8 May 2012, daily.sightline.org/2012/05/08/lane-countys-latino-residents/, viewed 9 May 2012.
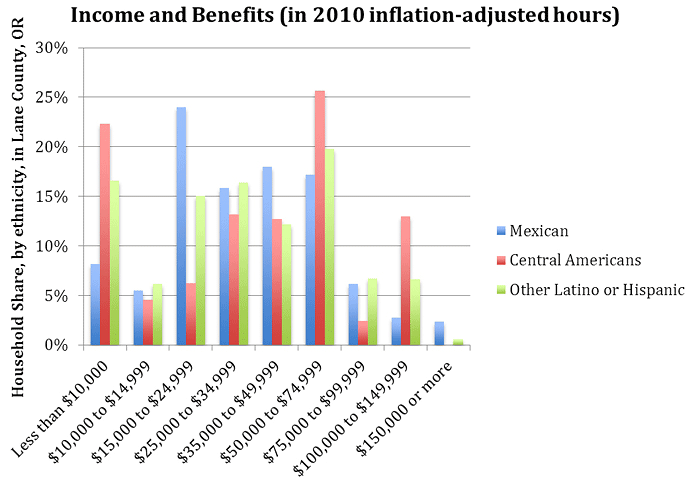
Significant differences in the income distribution of Lane County's three Latino subgroups
The U.S. Census estimates that Central Americans have the highest annual median household income, at $42,422, of all three Latino subgroups in Lane County. Mexican households, on the other hand, have the lowest annual median household income at $31,759.17 The most striking number, regarding income distribution among the three distinct categories the U.S. Census has assigned for Latinos in Lane County, is the percentage of Central American households that earn between $50,000 and $74,999 per year (see Figure 4); approximately 26 percent of Central American households find themselves in this income bracket. However, another interesting figure concerning Central Americans is that they also represent the largest share of households that earn less than $10,000 per year. This is probably explained by having a university located in the middle of a major agricultural area. The UO brings in many well educated Latinos from Central and South America, yet there are also Central American immigrants that work in the low wage agricultural sectors.
U.S. Census Bureau, 2006-2010 American Community Survey "Table DP03: Selected Economic Characteristics".